


Track Respondent portal results
You can easily monitor and compare the performance of all learners with a Respondent portal linked to your FlexiQuiz account.
The user report summarizes all assigned activities, including quiz progress, pass rate, average scores compared to others and detailed analytics.
You can download reports in PDF or Excel formats.
How to access Respondent portal reports
Admins and Trainers with Analyze reports permissions can access the information.
There are two ways to view the reports.
#1. Reports screen
- Log in to your FlexiQuiz account and select Reports from the top menu.
-
Next, select All users from the drop-down menu. A list appears of all Respondents, Trainers and Admins linked with your workspace.
- To find the relevant user, scroll down the page or enter their details (username, first name or last name) in the search box.
-
Once you find the user, press the + to view all activities that they have been assigned.
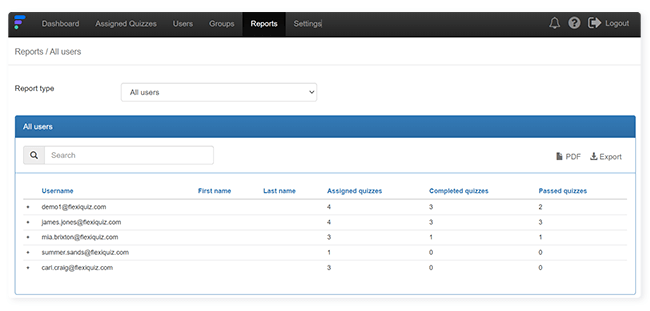
See below for a definition for each column.
#2. Users screen
- Log in to your FlexiQuiz account and select Users from the top menu. Your users dashboard will appear.
- Click on the required user to display their profile page.
-
Next, choose the Results tab and a summary of all assigned quizzes will appear.
- You can view the following information:
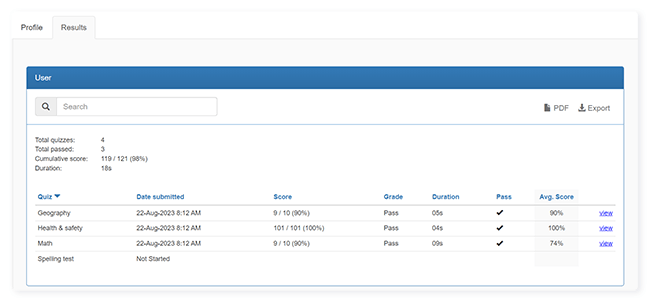
- Total quizzes: Total number of quizzes or activities assigned to the user.
- Total passed: Number of quizzes where the user has a passing grade.
- Cumulative score: Total score of all submitted quizzes.
- Duration: Time taken on all activities.
In addition, there is a list of all assigned quizzes - see below for a definition for each column.
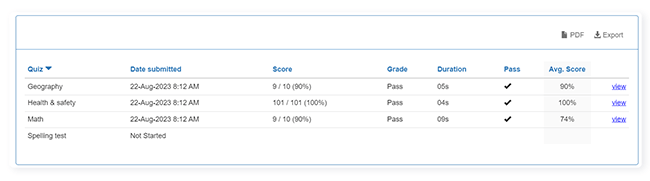
Definition for each column
Quiz: Name of the quiz or activity.
Date submitted: Shows if the user has started and submitted the quiz. If the quiz has been submitted, the date will show.
Score: Number of points the respondent earns out of the total available.
Grade: Custom grade.
Duration: Amount of time the user spends on the activity.
Pass: A tick appears if the user achieves a pass grade.
Avg. score: The average score (shown as a percentage) of every who submitted the quiz. You can compare the users performance against the rest of the group with the score and avg. score columns.
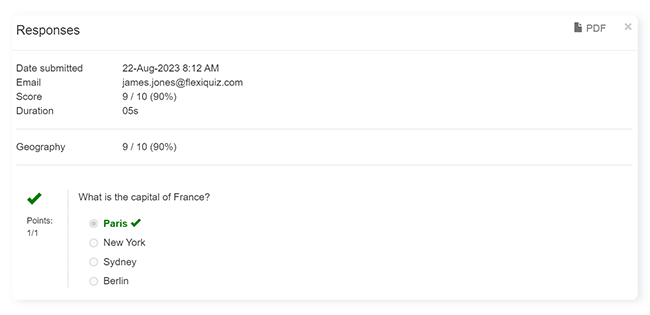
View: Lists all questions and the user response. The report can also show category scores and time taken per page.
Frequently asked questions
Does the report include live quizzes or tests completed using a quiz link or email invitation?
No, the report only includes quizzes or activities you assign to the user's Respondent portal.
Relevant help guides
How to create a Respondent portal
How to assign a quiz to a Respondent portal
Back